

Working with a lot of data analysts lately and seeing athletes redefine what’s possible has gotten me thinking about data, chaos and performance.
The Numbers Underneath
Some pursuits have a luxurious stream of data. Running an online business? The data feedback can be instant. Building a world class race car? The metrics are built into the car’s design for a constant flow of readings.
Some pursuits are numbingly consistent. Accounting data entry doesn’t often offer variation in performance or opportunities for peak performance.
But in most of our life, the data is more spare and varied, and our observations are often flawed.
The human brain tends to emphasize the negative. It can take several positives to equal the impact of one negative. Numbers can help us stay connected to reality.
Putting Numbers to Work
No matter how much data we have, the key is how we use it. In fact, we can separate ourselves from the vast majority of others by just paying attention to what’s working, noticing patterns, approaching improvement with intention.
Doing this gives us access to improvement and performing at the biggest moments. The book and film Moneyball were about this.
Four Patterns of Performance
Visualizing data can help unlock opportunities. If we had a set of a data points – like for instance competition statistics – we could see a more objective view of our performance than our brain will ever give us.
For instance, if we’re not approaching things intentionally, a year-long graph of our good, average and worst performances might look like this:
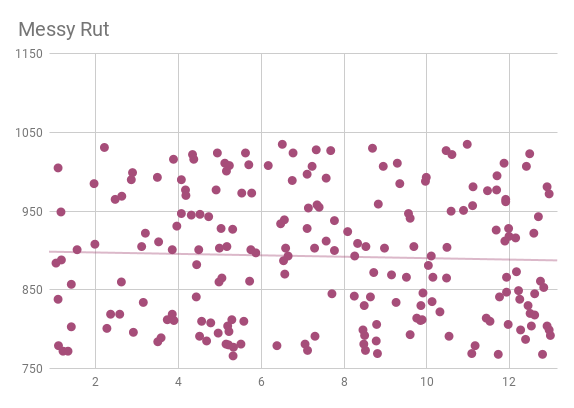
Across our purple year, we have some peak moments but we are really inconsistent. It’s just as likely that we will have a lifetime best on any given day as an all-time low, and we are not improving over the course of the year
Let’s call this the messy rut. If we care about performance, we’re probably frustrated with these results.
Then there’s this graph:
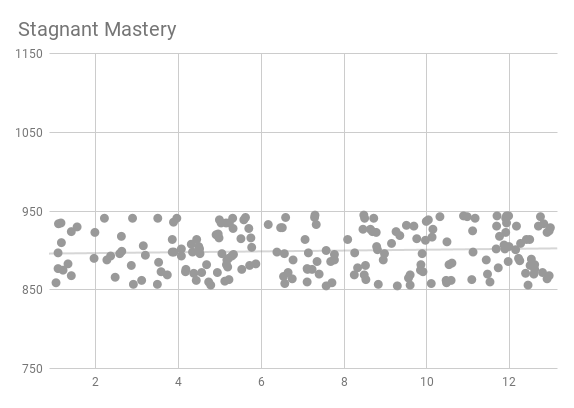
In this gray year, we have fewer lows but also fewer highs. We’re consistent, but consistently average, and we’re not improving. If we care about getting better, this year might feel worse than a messy rut. This might be called stagnant mastery.
And yet it’s probably a better launching point. This graph shows mastery of this level. We don’t know what the ceiling of our skill is, but we’ve established a solid floor to our performances. We just don’t have horribly bad days.
And that’s not going to get us to the top. What we need is something different. Maybe it’s this:
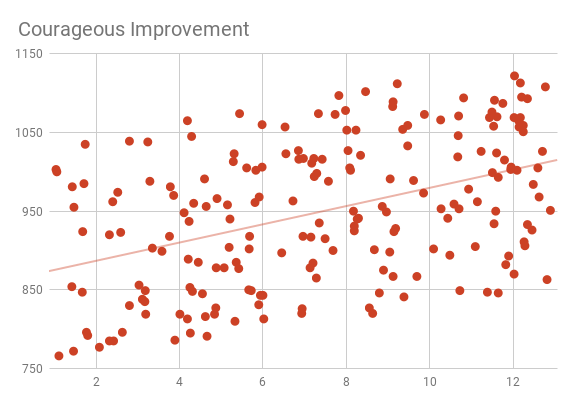
In our red year, we’re getting better. Average performances at the beginning of the year become our poor performances just a few months later. And the path is chaotic.
This is what it means to risk being great.
We’ve made our plan for improvement. We’re doing the work. And we’re putting ourselves out there. We’re getting some wins, but we know it’s going to come with some fails too.
The fails are part of the plan. We’re improving our results so that our target finish happens more often, whether that is making the cut, placing in the top 10 or winning. We are putting ourselves in the mix more often.
Let’s call this courageous improvement.
And then there is the blue year:
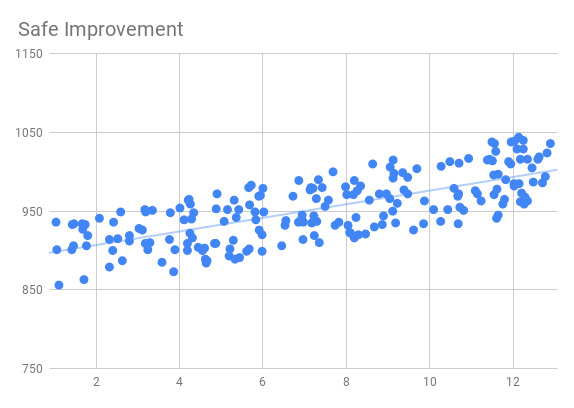
This graph looks great. No big fails, a steady feeling of things getting better. Near constant positive feedback. Sign me up!
Let’s wake up from that dream. Blue years are mostly fantasy, and fantasy isn’t all it’s cracked up to be.
While a blue year might feel good, let’s take a closer look. If we’re competing against someone in a red year, we’re losing to them often. They are often putting up transcendent performances. We are top performers, grinding out good results and putting distance between those in ruts or stagnation, but we’re unlikely to win many year-end awards.
It’s not all bad. We are improving. We’re working as intentionally as someone in a red year. We’re logging wins, but probably winning means too much to us. Short-term results are clouding our vision of what our true potential is.
Let’s call this safe improvement.
We’re really talking about learning curves here. Are you even on a learning curve? If so, what kind are you choosing to be on?
You Can’t Win Them All
Not all our results SHOULD be first place. If so, we may be stagnating. This is how champions get dethroned. They scrap and battle to get to the top, then stop fighting as hard.
Even though variation in performance can be tough to stomach, that chaos can be a helpful sign that you’re taking risks toward breakthroughs.
Acclimatize
When climbers take on the highest mountains in the world, they don’t get to just arrive and make a push to the top. The air is too thin. Their bodies haven’t yet adjusted to extreme altitudes. They have to make small journeys to intermediate altitudes to build the ability to summit in deadly thin air.
It’s like that with extreme performance too. As we expand our capacity upward, we may have spikes of achievement, but we’re not quite ready to do it often. We have to acclimatize to that level of performance so it becomes more normal and sustainable.
This is where the blue graph becomes more real. Instead of being a year of constant improvement without disappointment, the blue graph often is a short period of consolidation when inconsistent new skills become fully part of our arsenal.
Higher Than The Summit
Here’s the trap – and the opportunity for greatness. If we stay in a mode of acclimatizing too long, we risk hitting a performance plateau. The blue graph fades into the gray graph or worse, the purple graph.
When we focus on getting used to doing incredible things, we might forget to imagine and reach for the next level of incredible things are. We might miss the higher summits we can aspire to.
We need chaos for the higher summits.
An ideal path navigates this tension between breakthroughs and normalizing what was previously impossible. Stay in breakthrough mode too long and you don’t gain the mastery needed to reach much higher. Stay in consistency mode too long and things get stale or worse, move backward.
The Off Season
The off season is used as a playground to explore this tension. Commit to red territory when there is more time for exploration and risk, then gain enough command of new skills to return to gray (stagnant mastery) or even better blue (safe improvement) by the beginning of the next season.
A Life Cycle of Chaos
In real life these graphs are not as clean. They transition from one to another. When we’re starting out, we have that beautiful and crazy upward trend of courageous improvement. Our passion for learning takes us quickly higher and higher, but our performance is hit or miss.
For most people, the graph turns into a messy rut when they plateau without intentional strategies for improvement.
This S-curve pattern is well-documented, especially in business.
To reach our potential, we want something more than a single S-curve. We want to go higher and higher. We do that by linking S-curves together.
As soon as we sense we are leveling off, we call on our old friend chaos again, trigger the next curve and give ourselves the chance at greatness.